Infographics People Actually Read
Turning regulations, services and statistics into content that survives a fast scroll.
 Omar FawziSenior Art Director, Riyadh ·
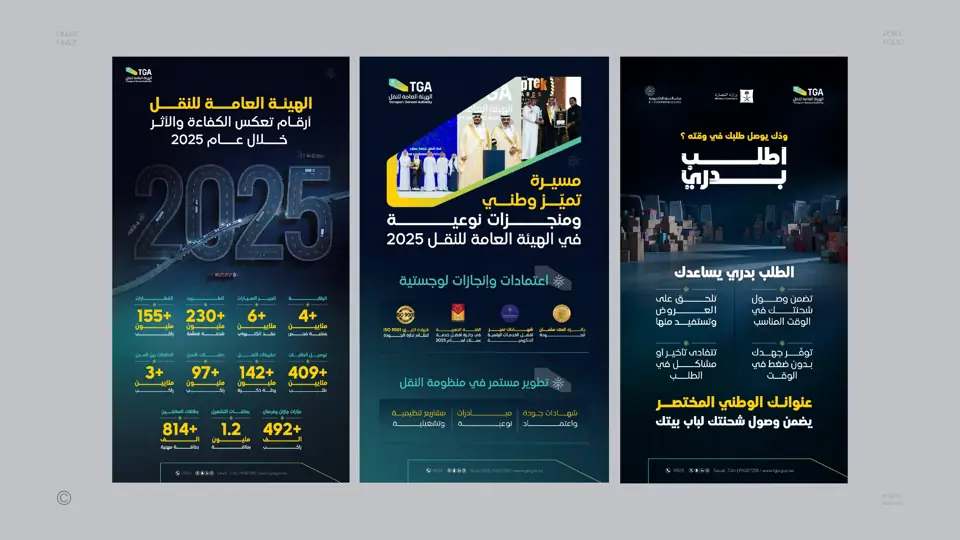
Most infographics fail for the same reason: they try to show everything. Working on campaigns and social content for the Transport General Authority and data-heavy reports for the Saudi Water Authority taught me that an infographic is an editing job before it is a design job.
Find the one number, or the one step
Every piece of information has a centre. Sometimes it is a single statistic, sometimes it is the first step of a service. I find that centre first and make it the largest thing on the page. Everything else supports it.
Order is the design
People read in a sequence: big, then medium, then small. If the sequence matches the logic of the information, the design feels effortless. If it does not, no amount of icons will save it.
Icons are not decoration
An icon should replace words, not sit next to them. If the icon needs a label to be understood, it is probably the wrong icon. In Arabic and English layouts, I also check that icons with direction, like arrows, flip correctly.
Design for the phone first
Most people meet an infographic on a phone, not in a printed report. I design the mobile version first, then expand it for print and presentations. The reverse almost never works.
A checklist before publishing
- Can someone understand the main point in three seconds?
- Is every number sourced and correct?
- Does it read correctly in both Arabic and English?
- Would it still work if the caption was never read?
Good information design is invisible. People do not notice the infographic; they simply understand.